Dashboards
Use dashboards in NocoDB to visualize data from your tables with charts, graphs, and metric widgets. A dashboard shows key insights to stakeholders in an interactive interface that you can configure.
Ask NocoAI
Copy a prompt, paste it into NocoAI in any base, and replace the words in [brackets] with your own.
- Build a dashboard that summarises [this table]
- Build a [sales] dashboard with [total revenue, deals by stage and revenue by month]
- Build a dashboard of [open tickets by priority and by assignee]
- Suggest a dashboard for this base
Getting Started
Creating a Dashboard
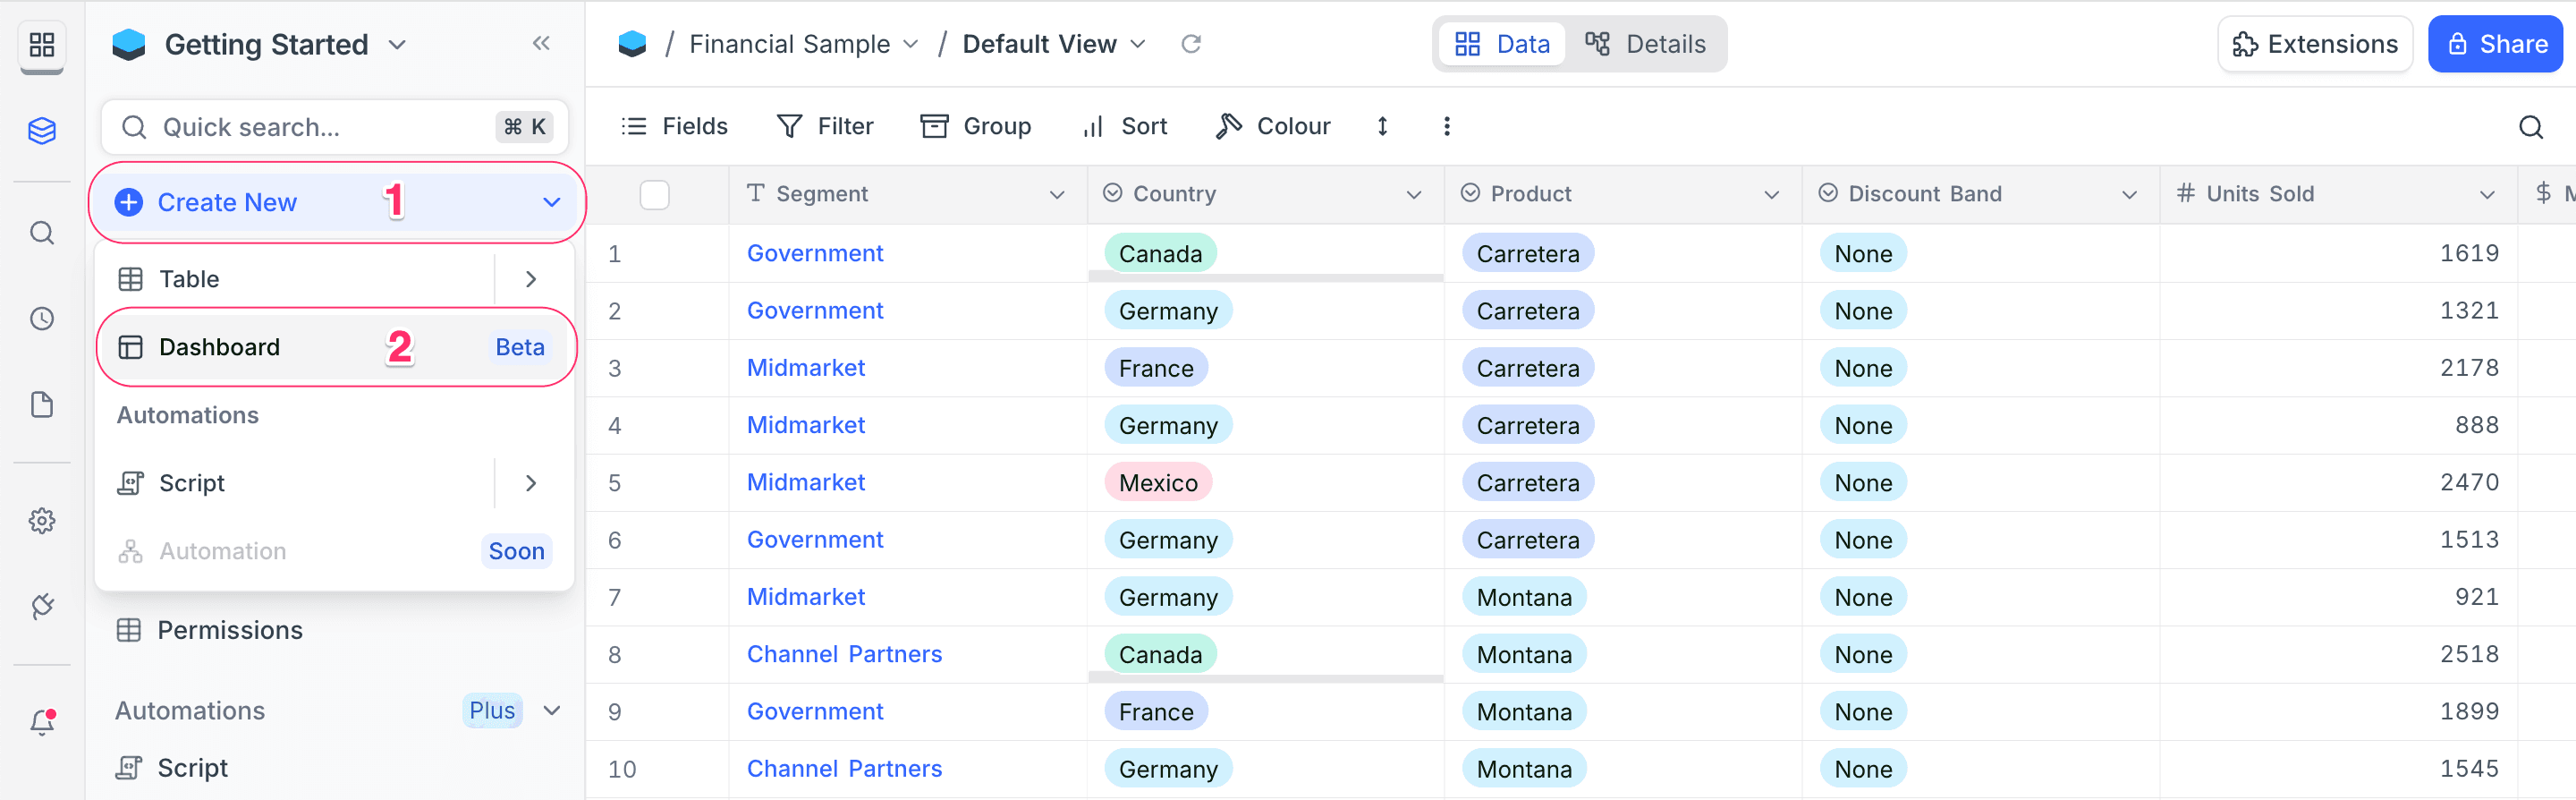
- In the left sidebar, click Create New.
- From the list, select Dashboard.
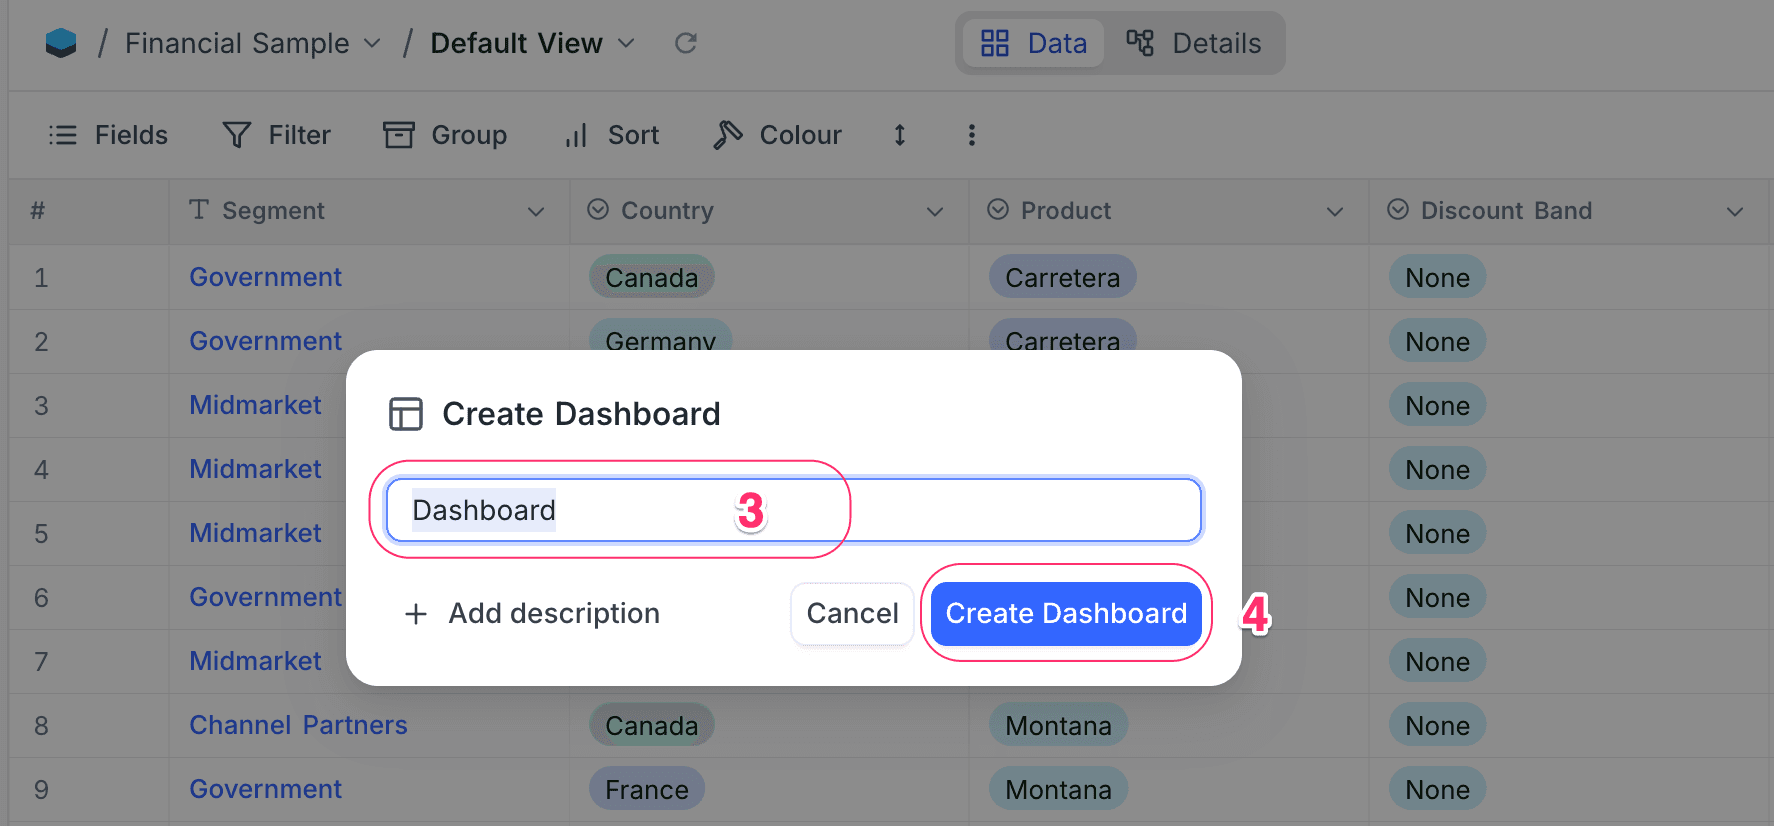
- Optional: enter a name for your dashboard. The default name is "Dashboard".
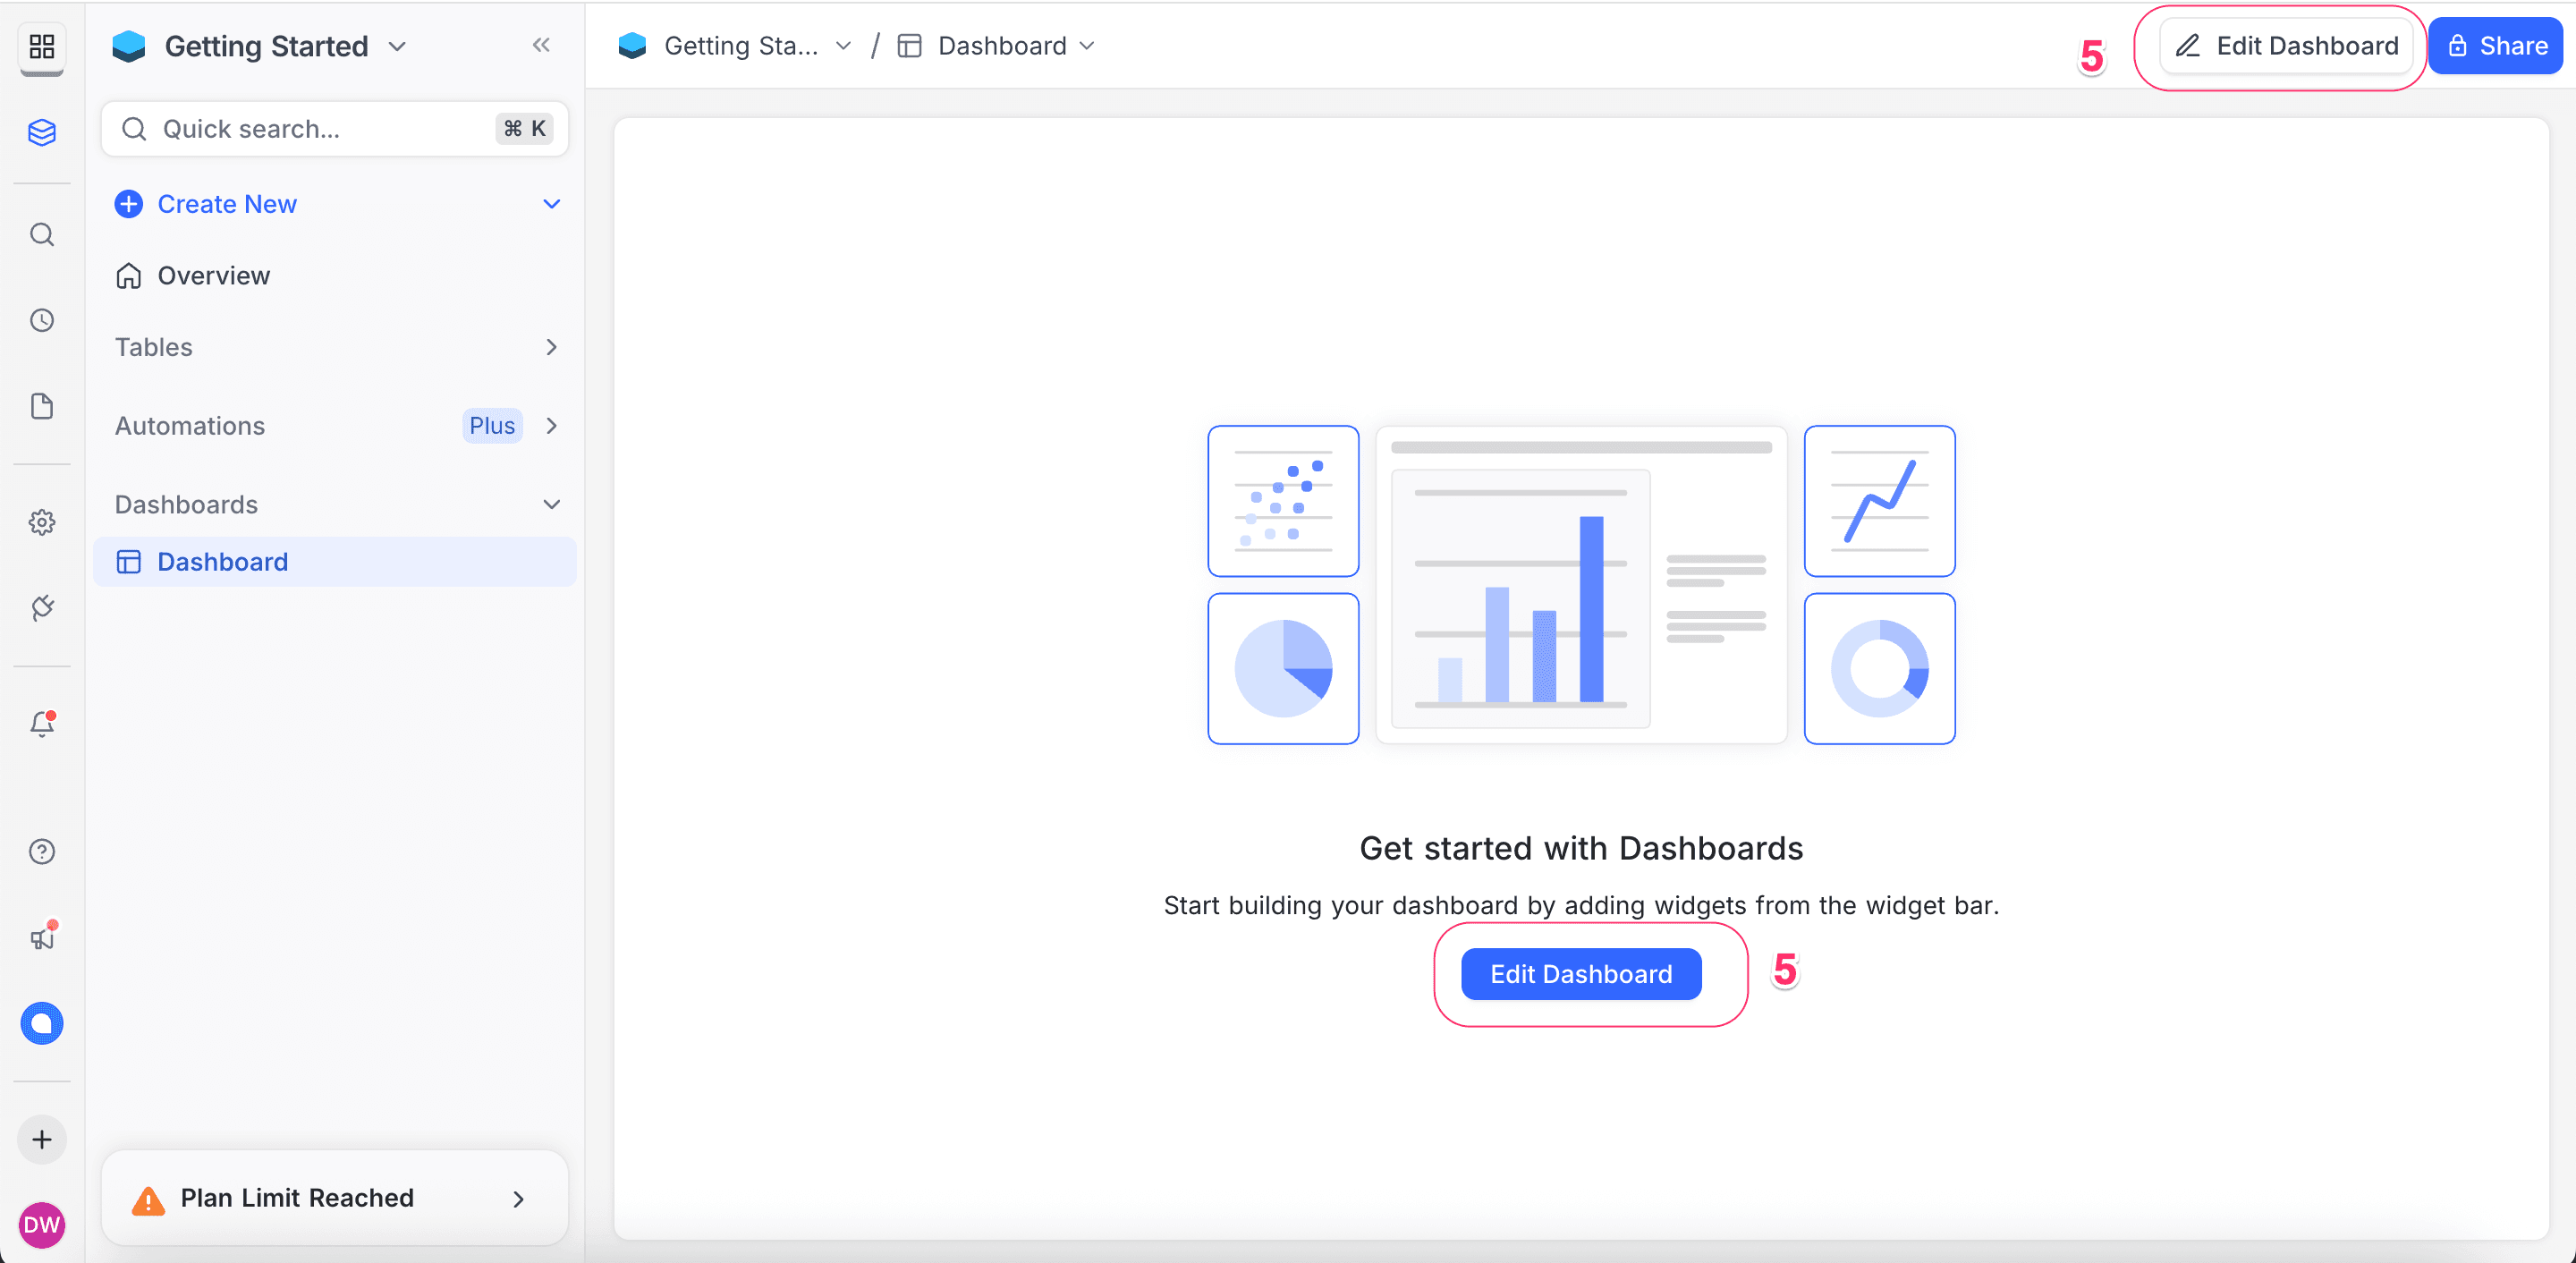
- Click Create Dashboard. The dashboard editor opens.
- To add widgets, click Edit Dashboard.
Managing Dashboards
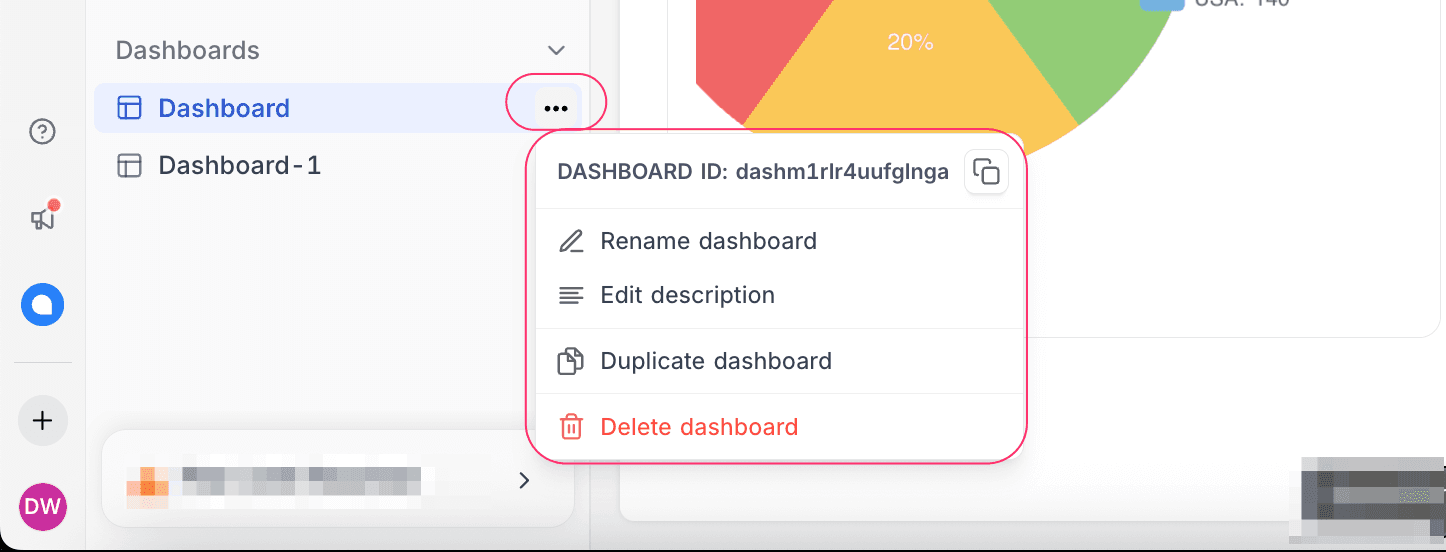
The dashboard context menu has these actions:
| Action | What it does |
|---|---|
| Rename dashboard | Changes the dashboard name. |
| Edit description | Adds or updates the dashboard description. The description shows when you hover over the i icon in the dashboard header. |
| Duplicate dashboard | Creates a copy of the dashboard. |
| Delete dashboard | Removes the dashboard. |
Sharing Dashboards
To share a dashboard publicly:
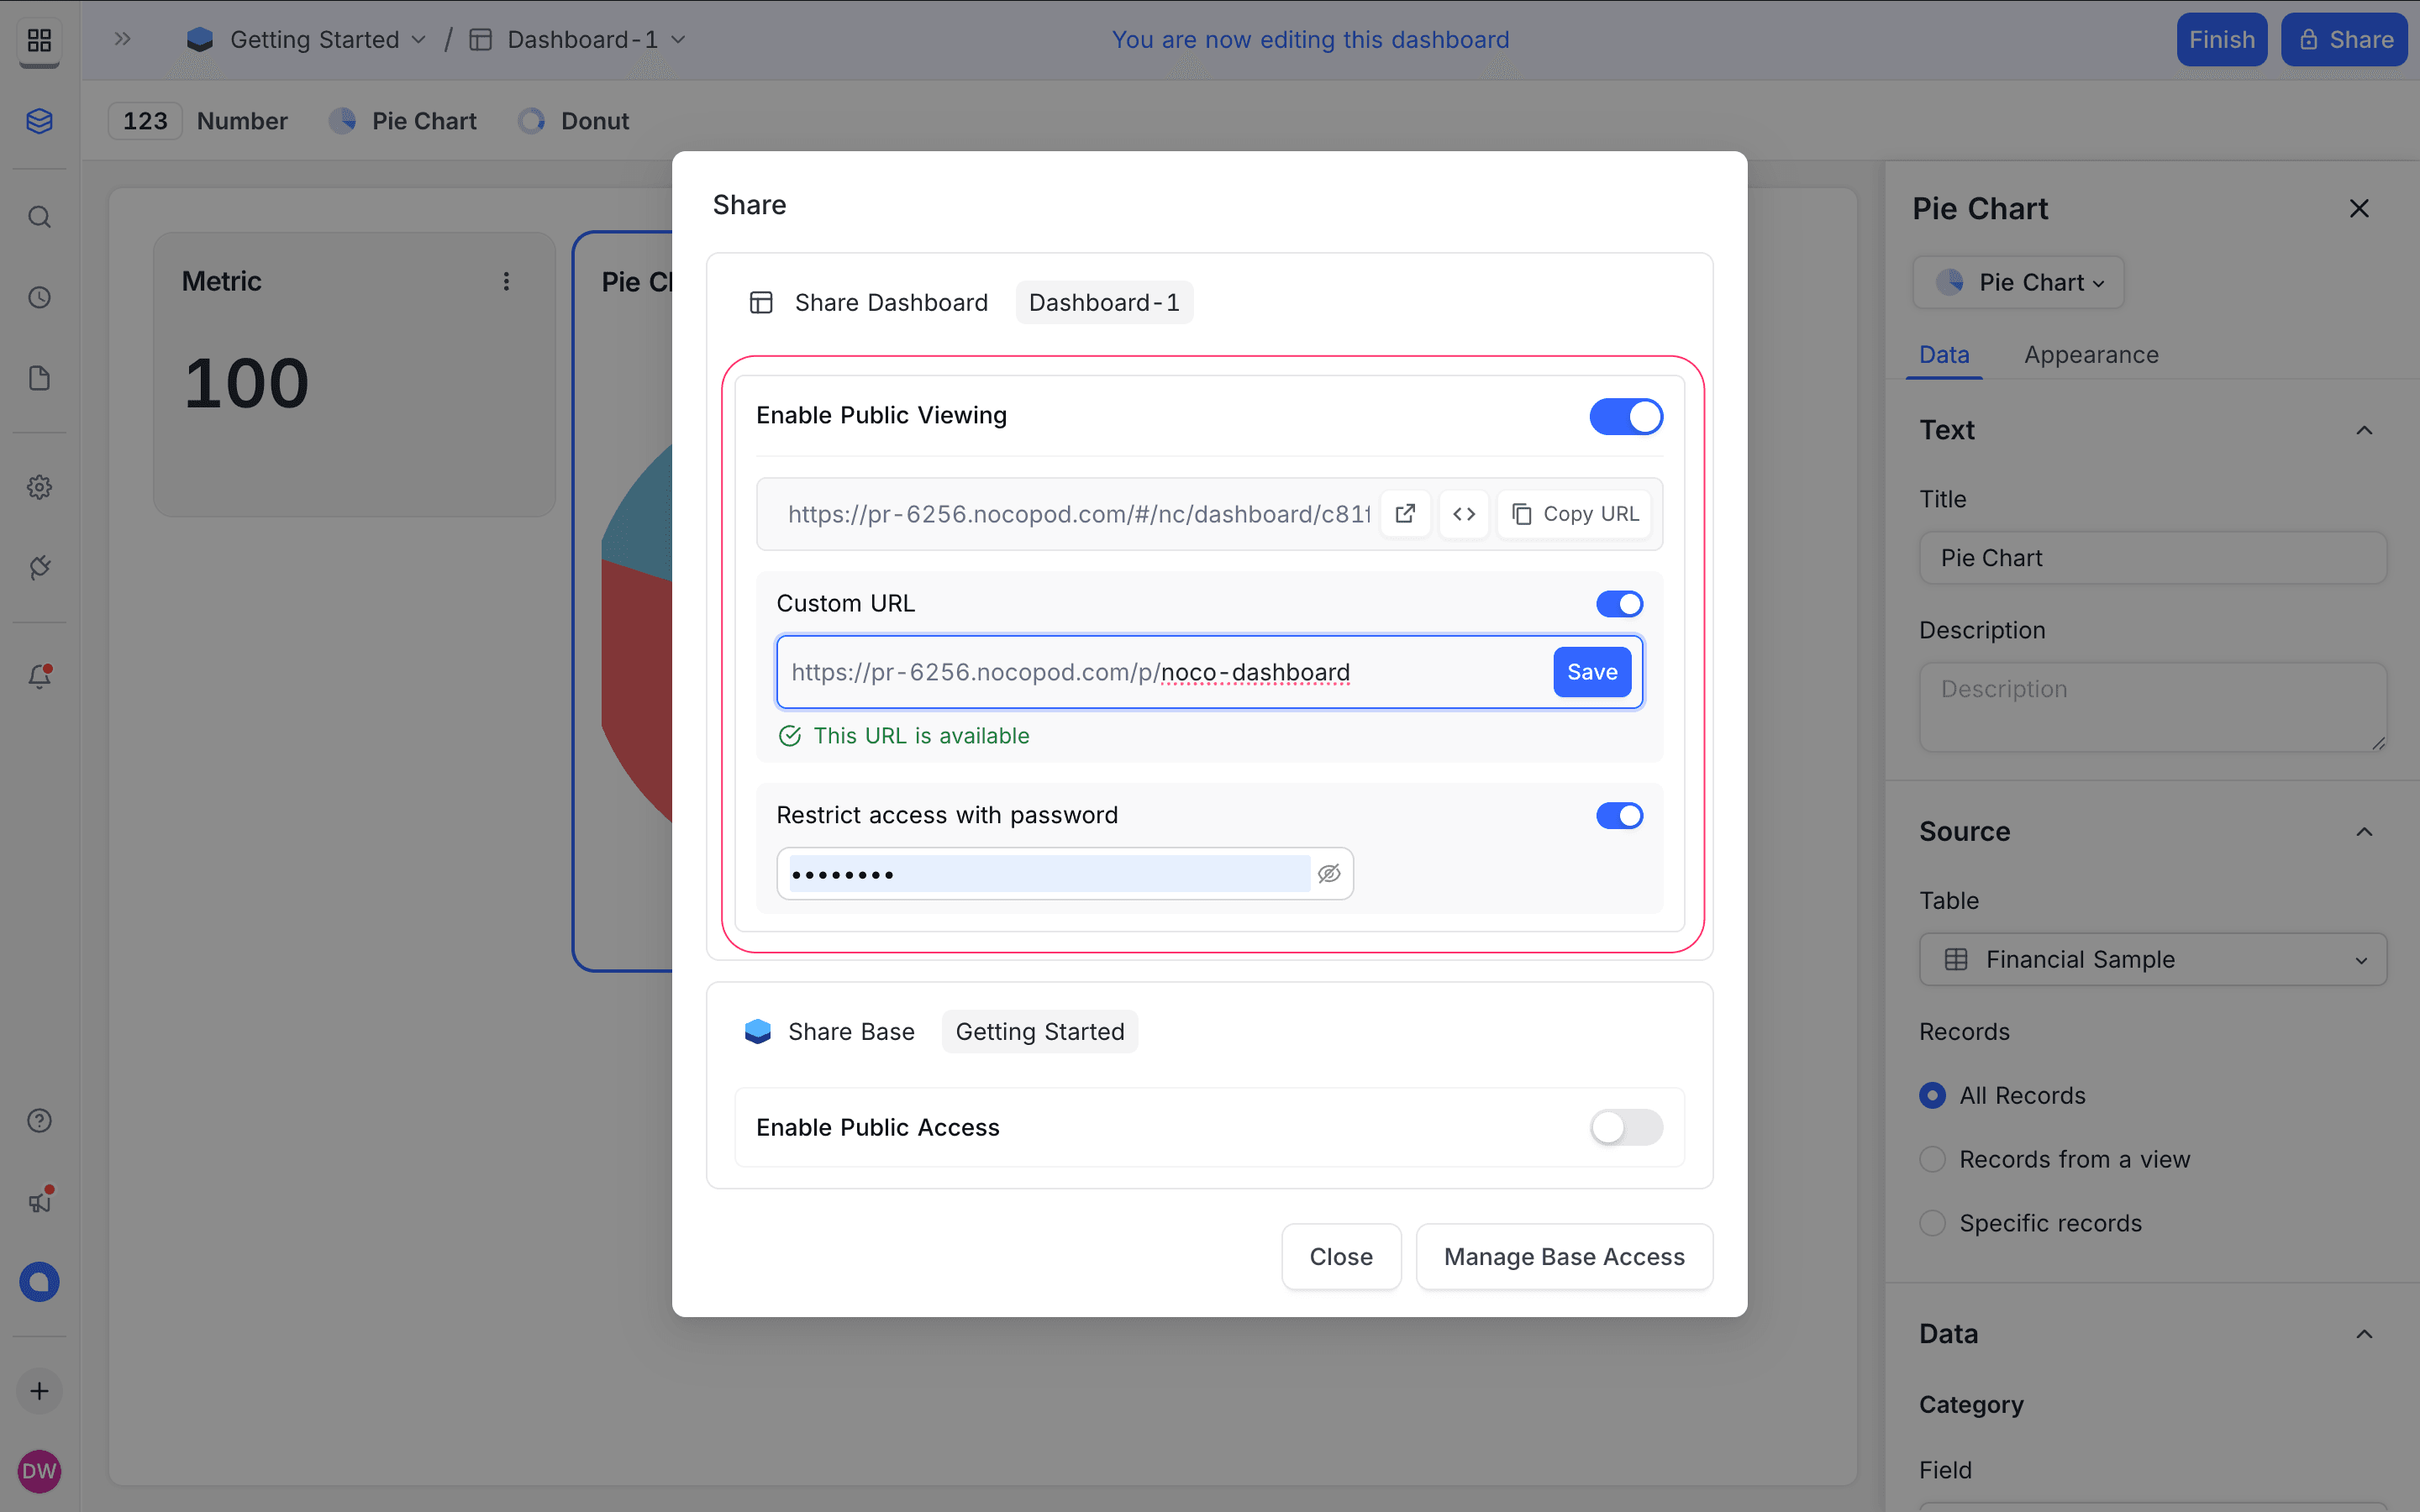
- In the top navigation bar, click Share.
- Turn on the
Enable Public Viewingoption. - Copy the link.
All people with this link can see the dashboard. They do not need a NocoDB account.
You can also:
- Set a custom URL for your dashboard.
- Set a password to control access.
Dashboard sharing works like view sharing. Refer to sharing views.
Dashboard Layout
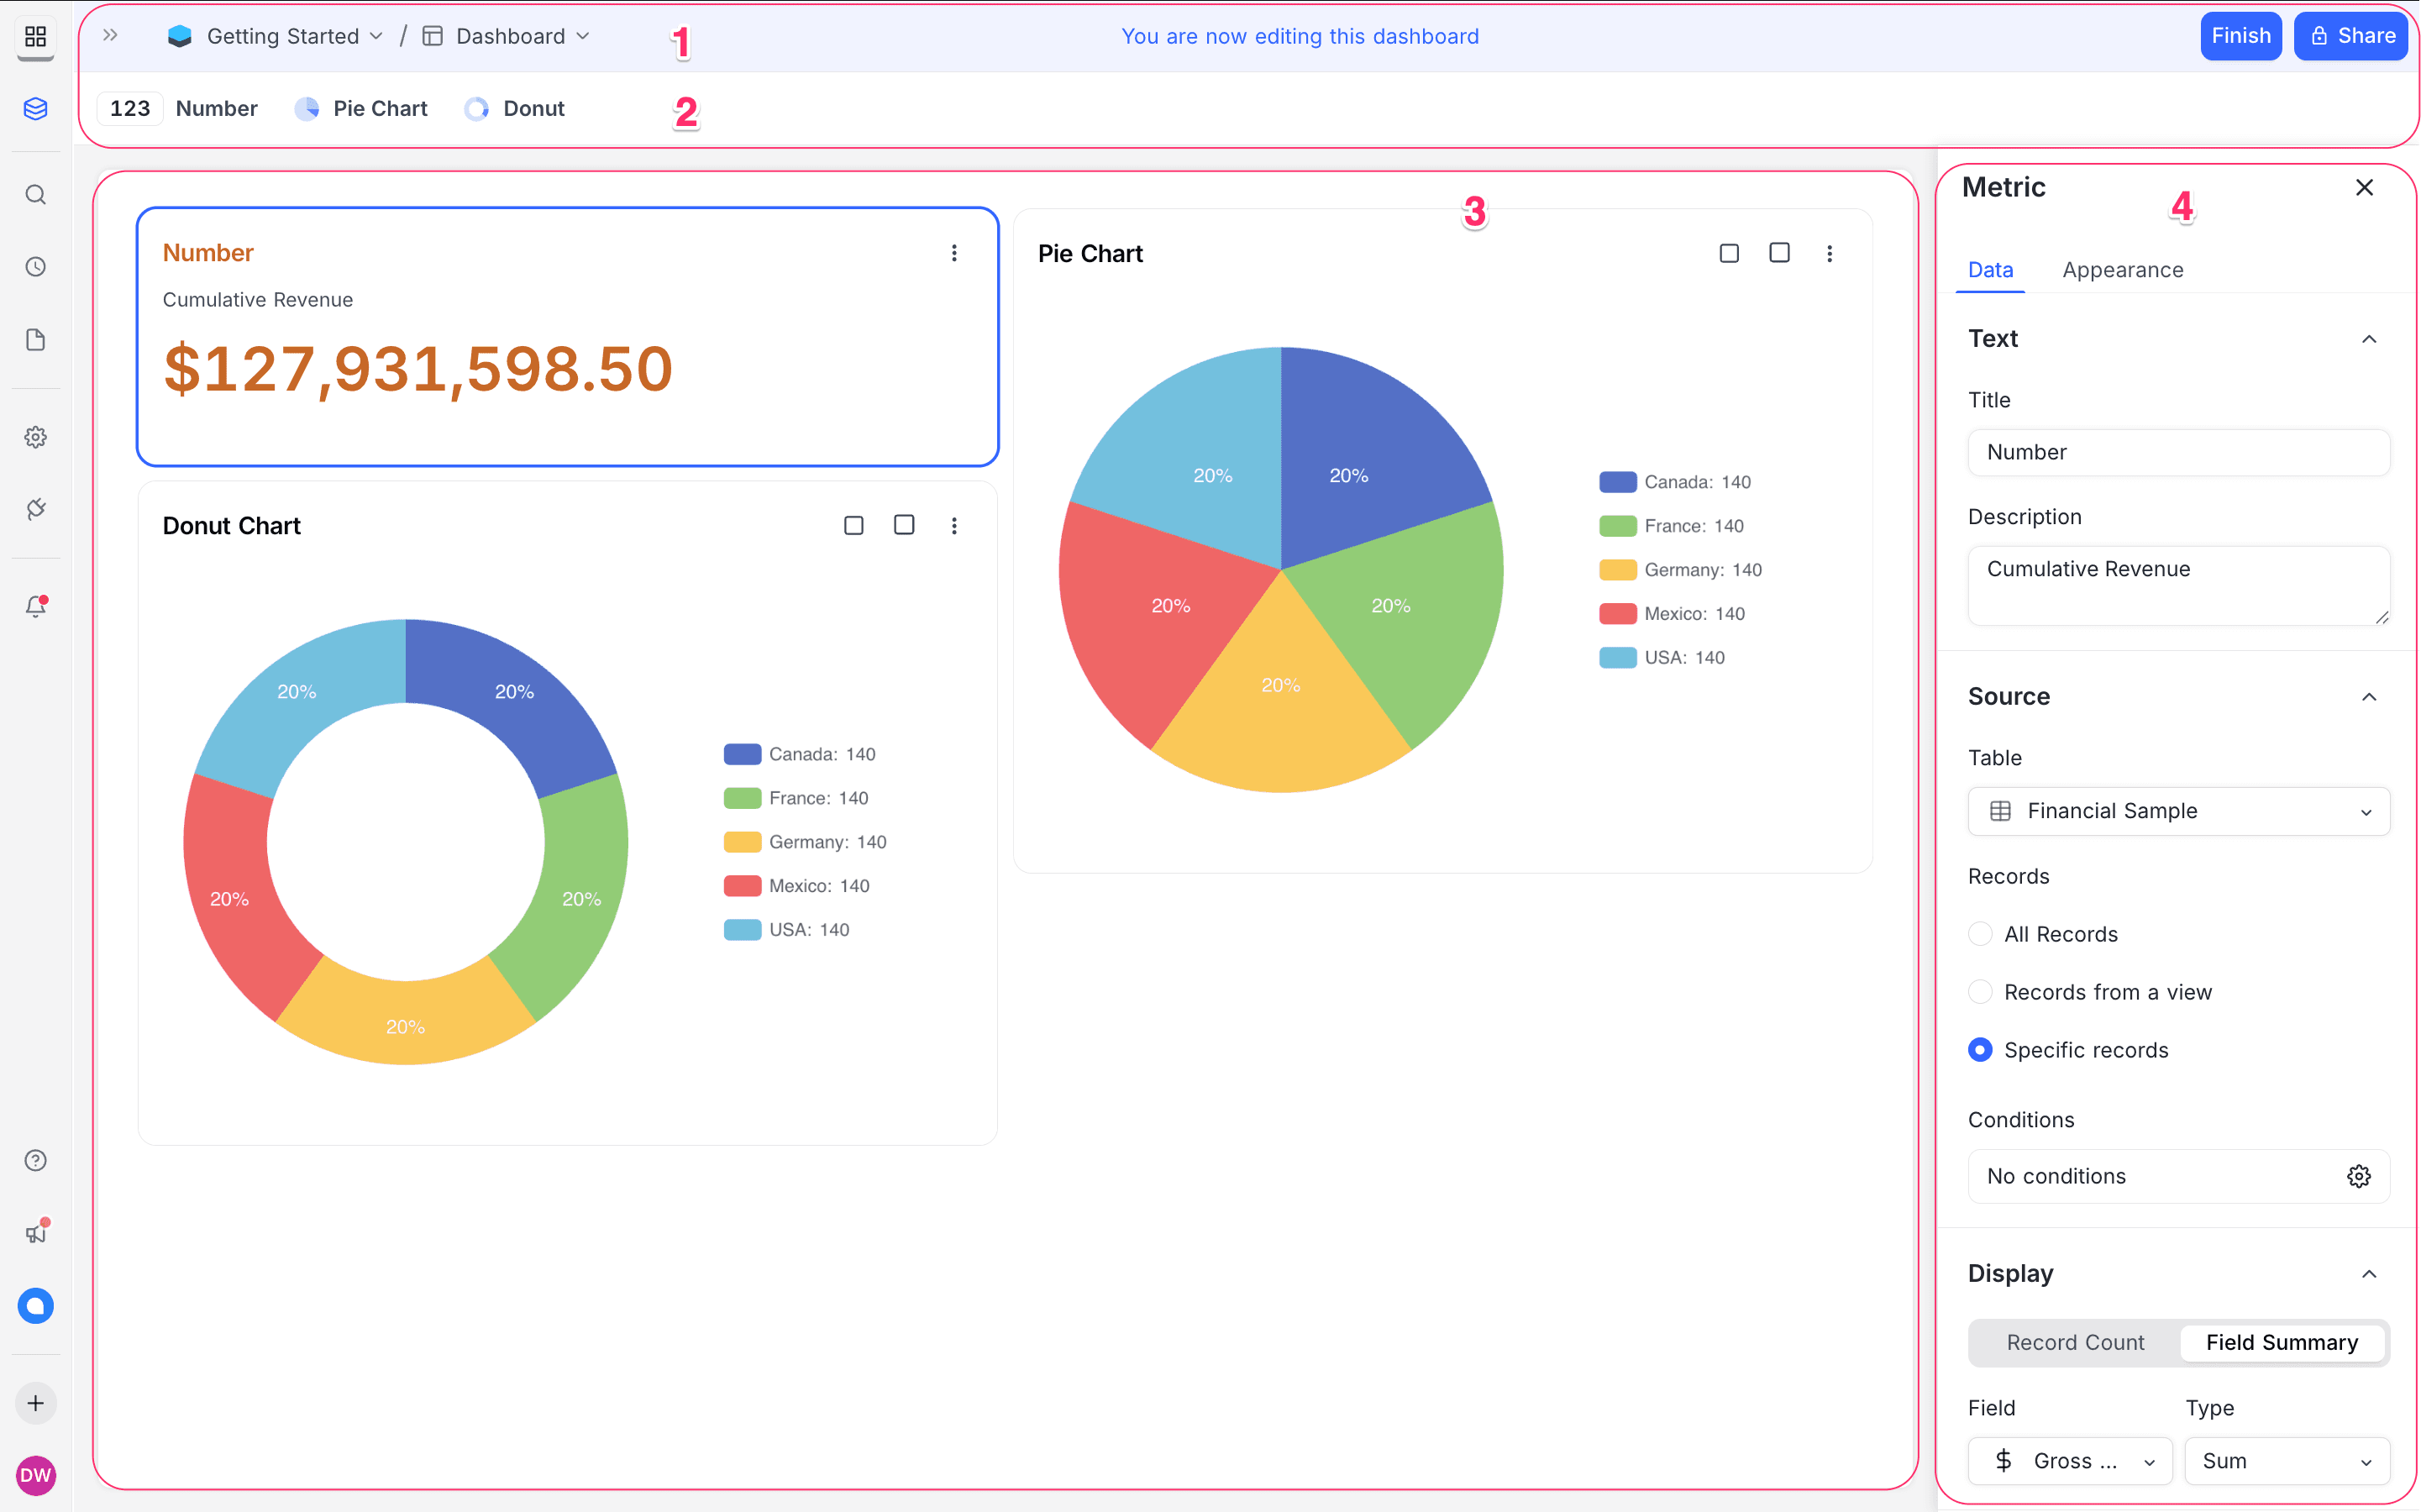
- Top Navigation Bar: Breadcrumbs and dashboard actions. Use it to switch between the dashboard View and Edit modes. You can also Share the dashboard with team members.
- Widget Bar: The toolbar at the top. It shows the widget types that you can add to the dashboard.
- Dashboard Canvas: The main area that holds the widgets. NocoDB uses a flexible grid layout. Drag and drop widgets to put them where you want.
- Widget Configuration Panel: The right panel. Use it to configure the properties of the selected widget.
Widgets
NocoDB dashboards have different widget types to visualize data. Add widgets from the widget bar at the top of the dashboard editor.
These widget types are available:
| Widget Type | Description |
|---|---|
| Number | Displays KPIs and metric summaries |
| Pie Chart | Visualizes parts of a whole |
| Donut Chart | Pie chart variant with a hollow center |
| Text | Displays static text |
| iFrame | Embeds external web content |
| Bar Chart | Bar chart variant with a hollow center |
| Line Chart | Line chart variant with a hollow center |
Availability
- Dashboards are currently in Beta and available on Plus and Business plans in Cloud.
Last updated on
Latest product updates?See Changelog